The Project
Interstellar dust plays a critical role in enabling star formation, and, through its emission, scattering, and absorption of light, affects nearly every astronomical observation made. We can better understand the dust and its effect on observations by measuring the amount of light extinguished by dust as a function of wavelength. We use spectroscopy from the APOGEE survey in concert with broadband photometry in the optical from PS1 and in the infrared from 2MASS and WISE to make precise measurements of the extinction curve and its variation throughout the Galaxy.
- Read the paper
- Download code implementing the extinction curve
Spatial Variation in the Dust Properties
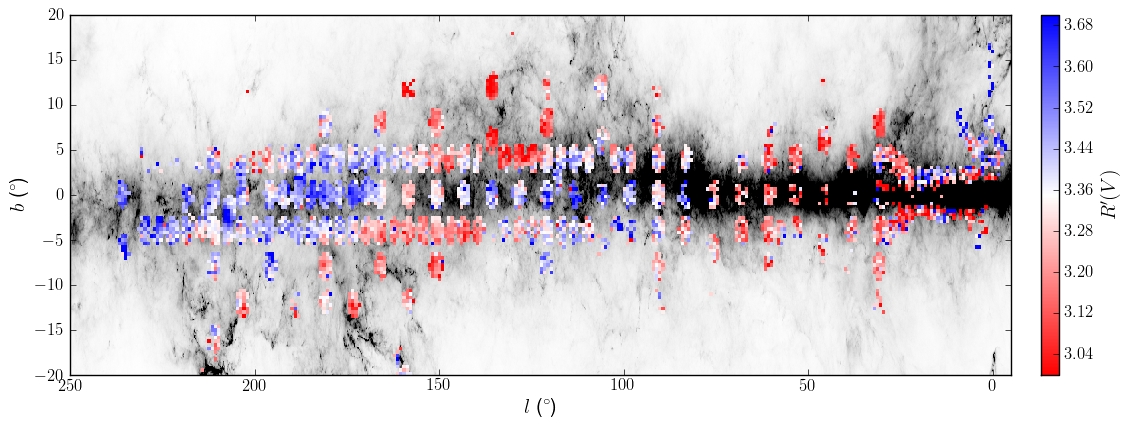
We find significant variations in the shape of the extinction curve, as parameterized by R(V), throughout the Milky Way. The variations are on scales significantly larger than individual molecular clouds or dense regions within those clouds, making them hard to understand purely as a consequence of grain growth in dense molecular regions.
The image shows the value of R(V) throughout the Galactic plane (colored points), where we have APOGEE spectroscopy and where the extinction is significant enough to allow the shape of extinction curve to be measured. The background grayscale shows the Planck dust map. The large red region extending from Orion (l, b) = (210, -20) through Taurus and California, crossing the Galactic plane at l = 150, and extending up into Cepheus is a large region of systematically low R(V), including many nearby molecular clouds.
We do not yet understand the physical mechanism behind the morphology of the R(V) map, but it is interesting that many of the low R(V) clouds are associated with the Gould belt.
The Correlation of R(V) and β
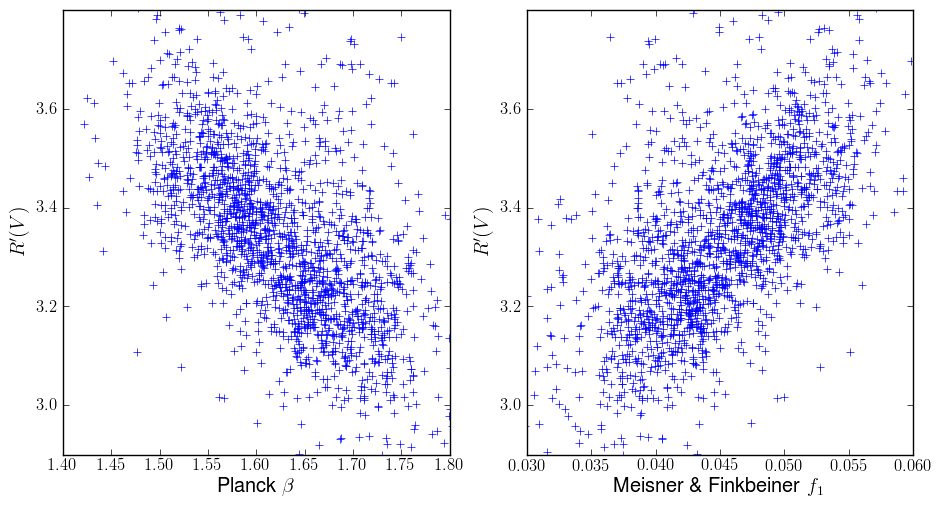
The dust extinction curve is not the only dust property that varies throughout the Galaxy. The temperature of the dust has long been known to vary, and the emissivity properties of the dust are known to vary as well. When we compare our extinction curve measurements with emissivity measurements from Planck, we find a tight correlation between the two. This relationship is not part of existing dust models, and places new constraints on dust physics.
It is not yet clear exactly what the variations in R(V) and β mean physically. Variation in the far-infrared spectral energy distribution have been interpreted as signatures of grain conglomeration, variation in dust optical properties, or variation in the relative amounts of dust with different optical properties (see this work). What we do know is that whatever is modifying the far-infrared SED of the dust also seems to lead to changes in the optical-infrared extinction curve.